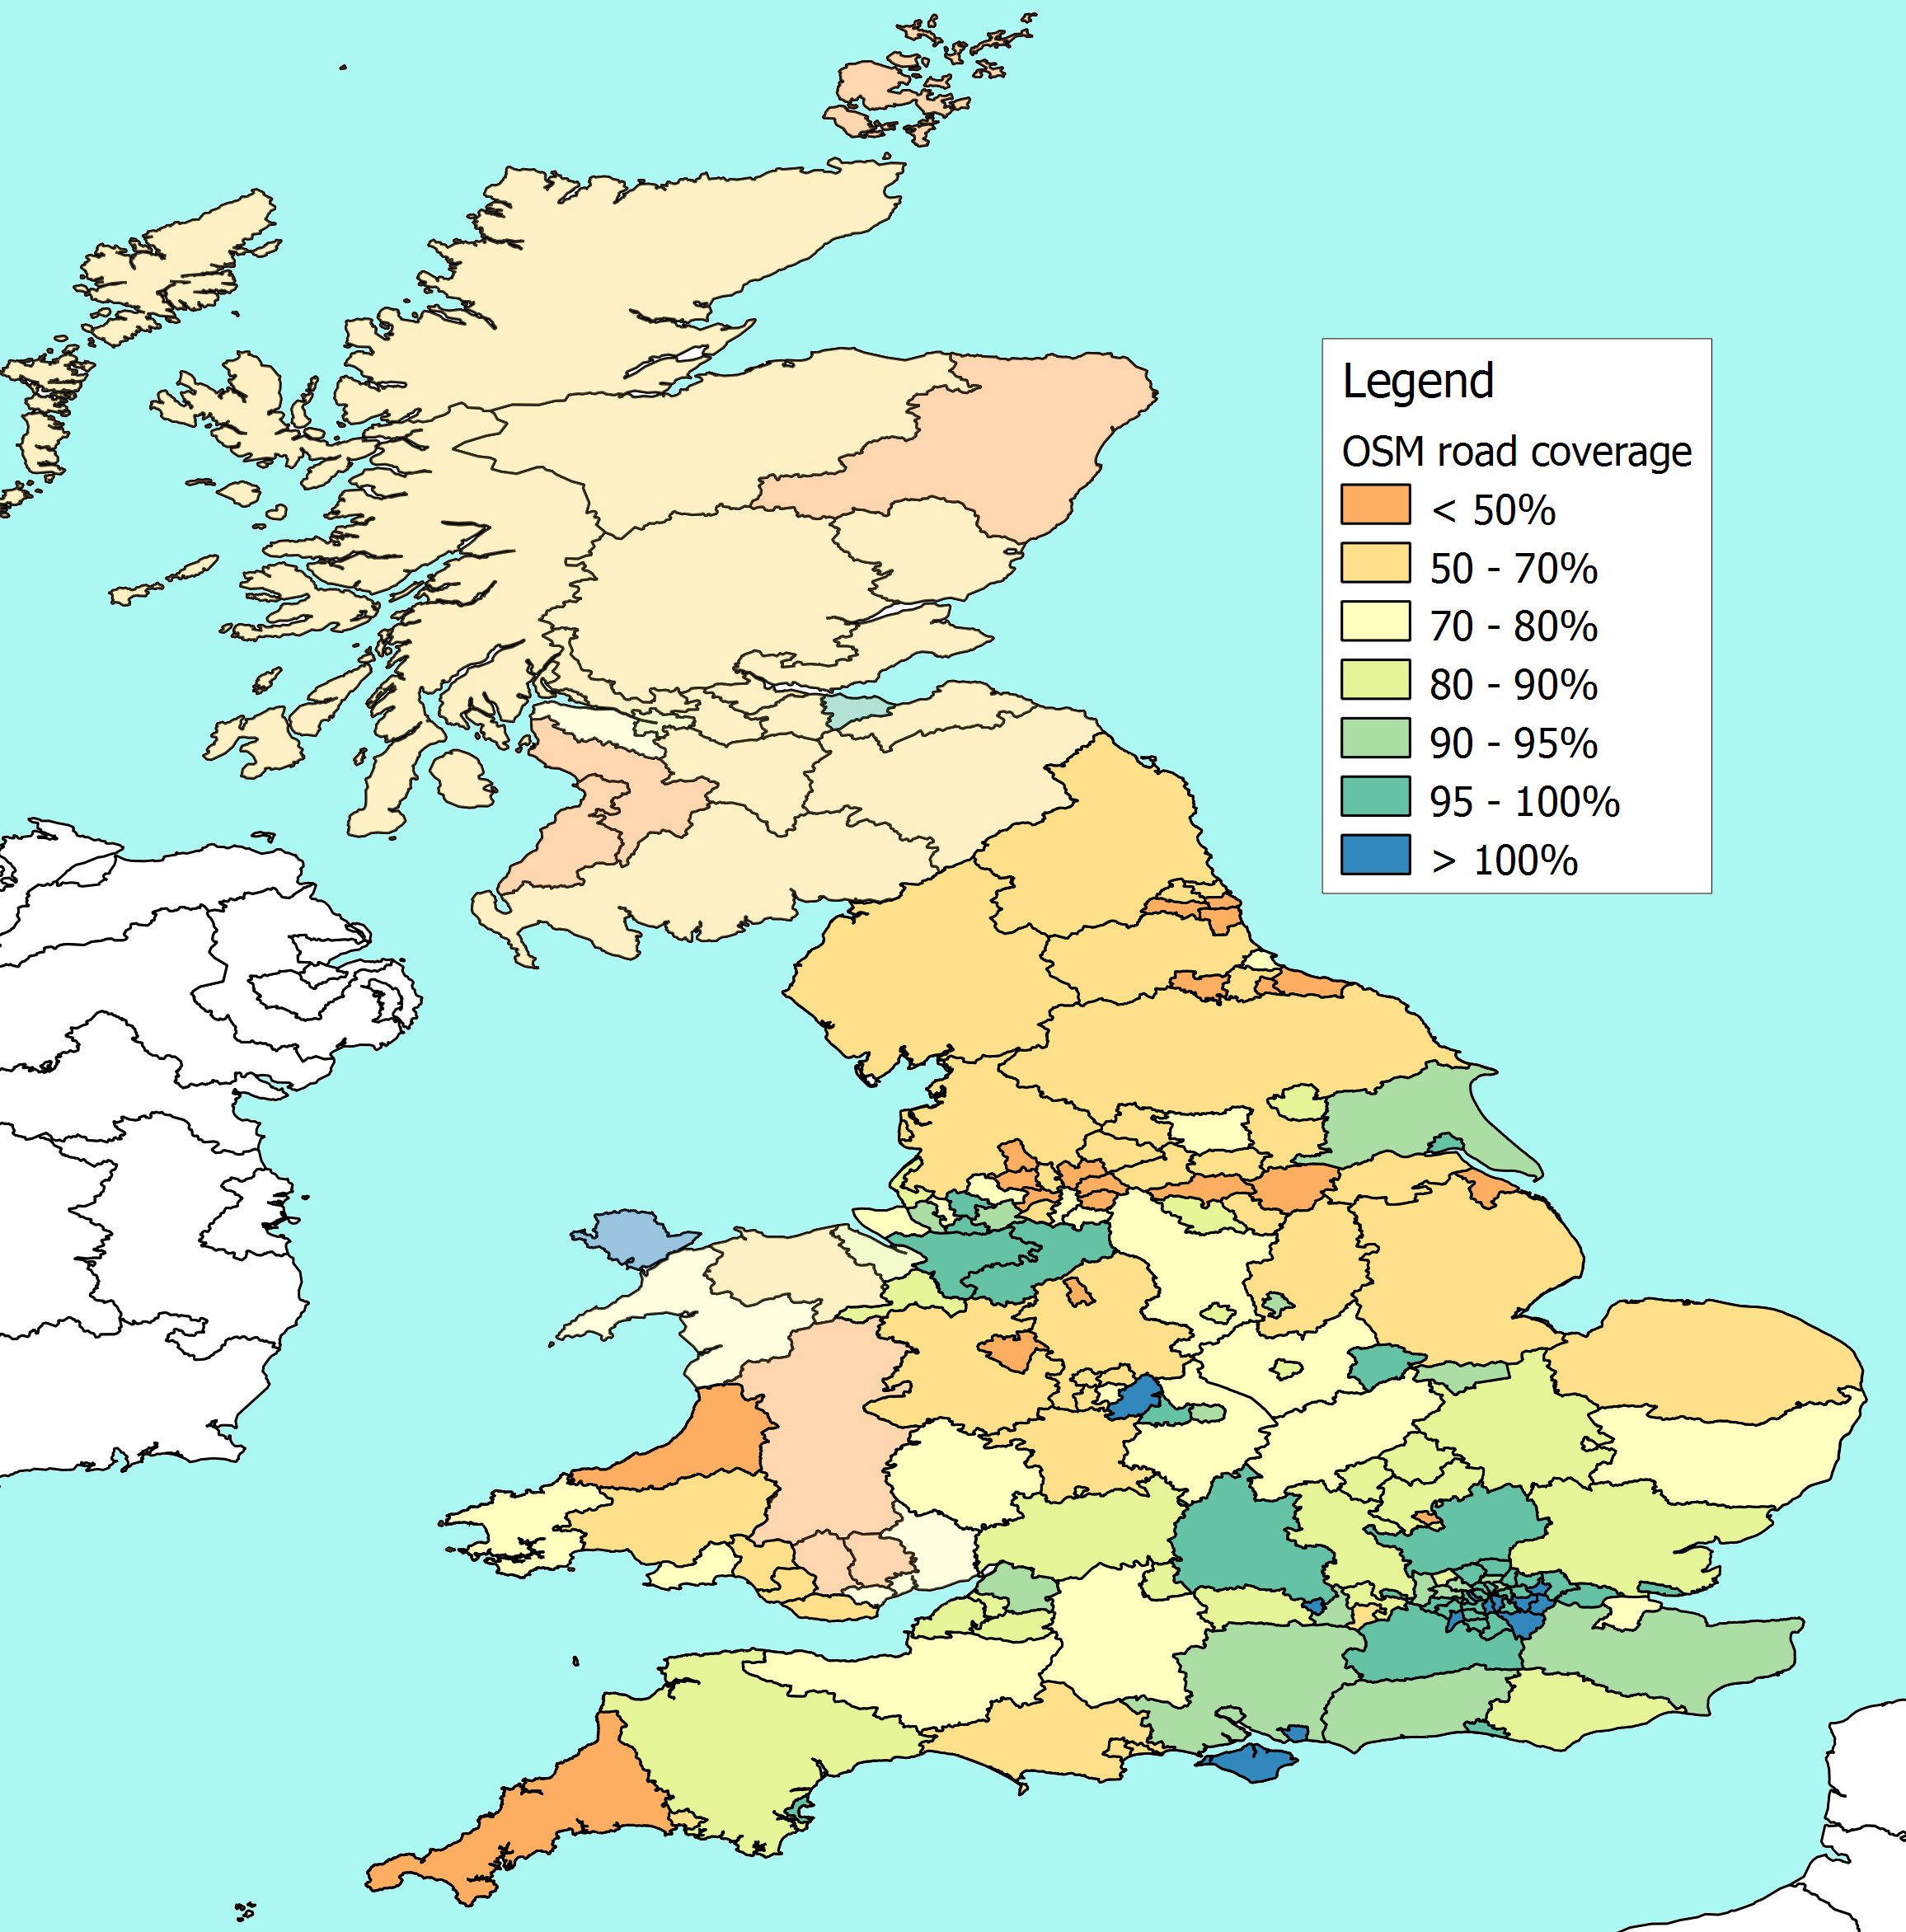
I've had a first attempt at measuring OSM coverage in Scotland and Wales using NUTS-3 regional boundaries as the common ground to compare Department for Transport statistics on the length of roads in a local authority against the length of roads plotted on OSM.
NUTS is the basis on which the EU publish regional statistics, and they provide the boundaries as shapefiles. The precision isn't as great as you get from admin boundaries on OSM, so this is a stop-gap until the boundaries for local authorities in Scotand and Wales are complete on OSM (or until the Ordnance Survey put them in the public domain).
On the whole the NUTS boundaries match up reasonably well with Local Authority boundaries. In some cases they are the same, in others I can aggregate the road lengths for a few authorities to get the figure for the equivalent NUTS region. It's only in the Scottish highlands where this doesn't work too well, because the local authority for the Highlands crosses several NUTS regions. So I needed to take an average across a big area of northern Scotland.
Nobody seems to like the colouring on this attempt very much, so that will need some more work. But meanwhile, the headlines are that Anglesey and Edinburgh look well covered. Glasgow, Renfrewshire, and Gwynedd look pretty good. While Powys, Aberdeenshire, Orkney and Shetland are looking a bit thin.
For anyone interested in doing a similar exercise elsewhere in Europe, I don't know what detailed figures are published at national level, but there are Eurostat figures for road lengths at the NUTS-2 level (i.e. the next largest geographical grouping after those I am using here). Eurostat only split "Motorways" and "Other Roads" so dealing with dual carriageways etc is going to be a bit iffy. However, I've done a quick comparison of their numbers for the UK, and the rough figures (motorways * 2 + other roads) gives me a total that isn't a million miles away from more detailed calculations. The Eurostat figures are here under "Regional Transport Statistics", and the Eurostat shapefiles that I used are here
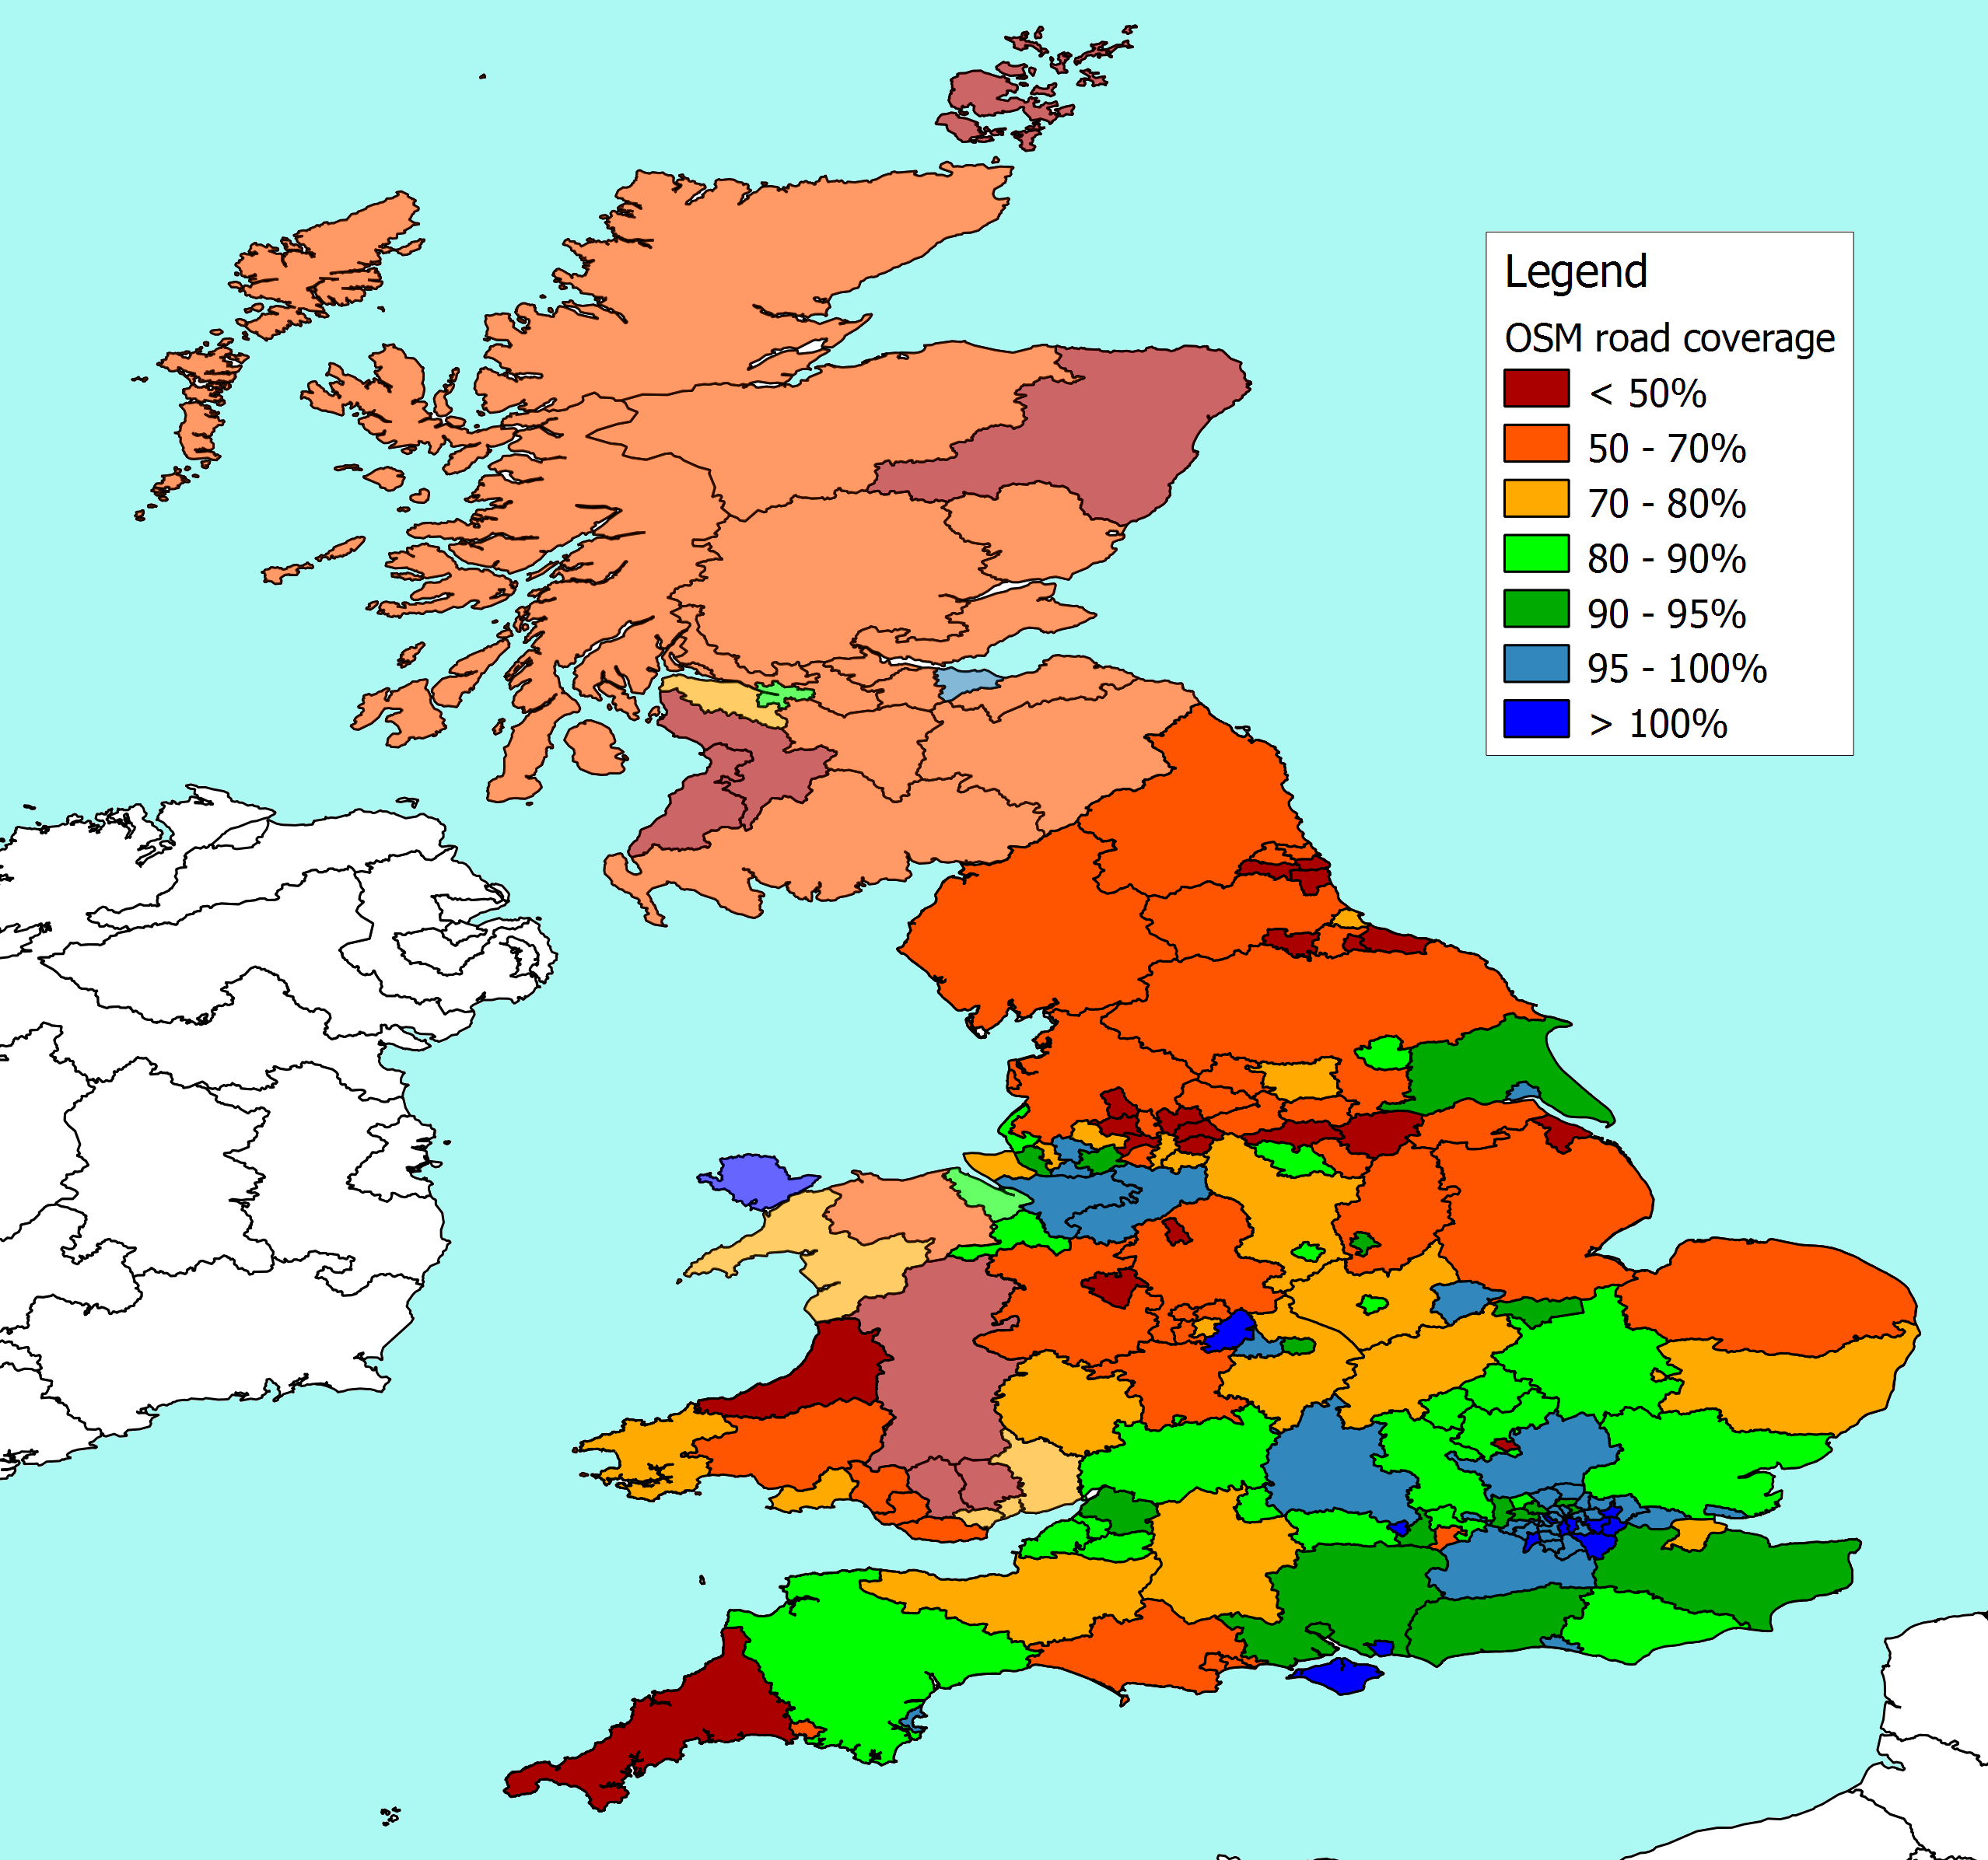
There's another version, with brighter colours here
3 comments:
Is it just me, or are the colours you've used in Scotland not there in the legend?
No its not just you - they are faded versions of the colours in the legend. It's more obvious in the Kodachrome version. Work in progress, by someone who is more comfortable with numbers than colours.
Dumfries and Galloway = 51% coverage - much the same as most of Scotland. See follow-up post.
Post a Comment