I've been doing more work on trying to estimate the level of OSM coverage in different parts of the UK by comparing the length of roads in the database with statistics for each local authority published by the Department for Transport. Since my first attempt there have been several improvements. Not least in the number of local authority boundaries for England that are available in the OSM database. It's now pretty much a complete set for the upper-tier authorities in England. Some district councils are still missing, but I can't use those anyway because the DfT statistics don't go down to that level. On top of that, my analysis is now more robust. I've fixed a problem with the map projection that I was using previously, and the way I classify different types of road is more systematic.
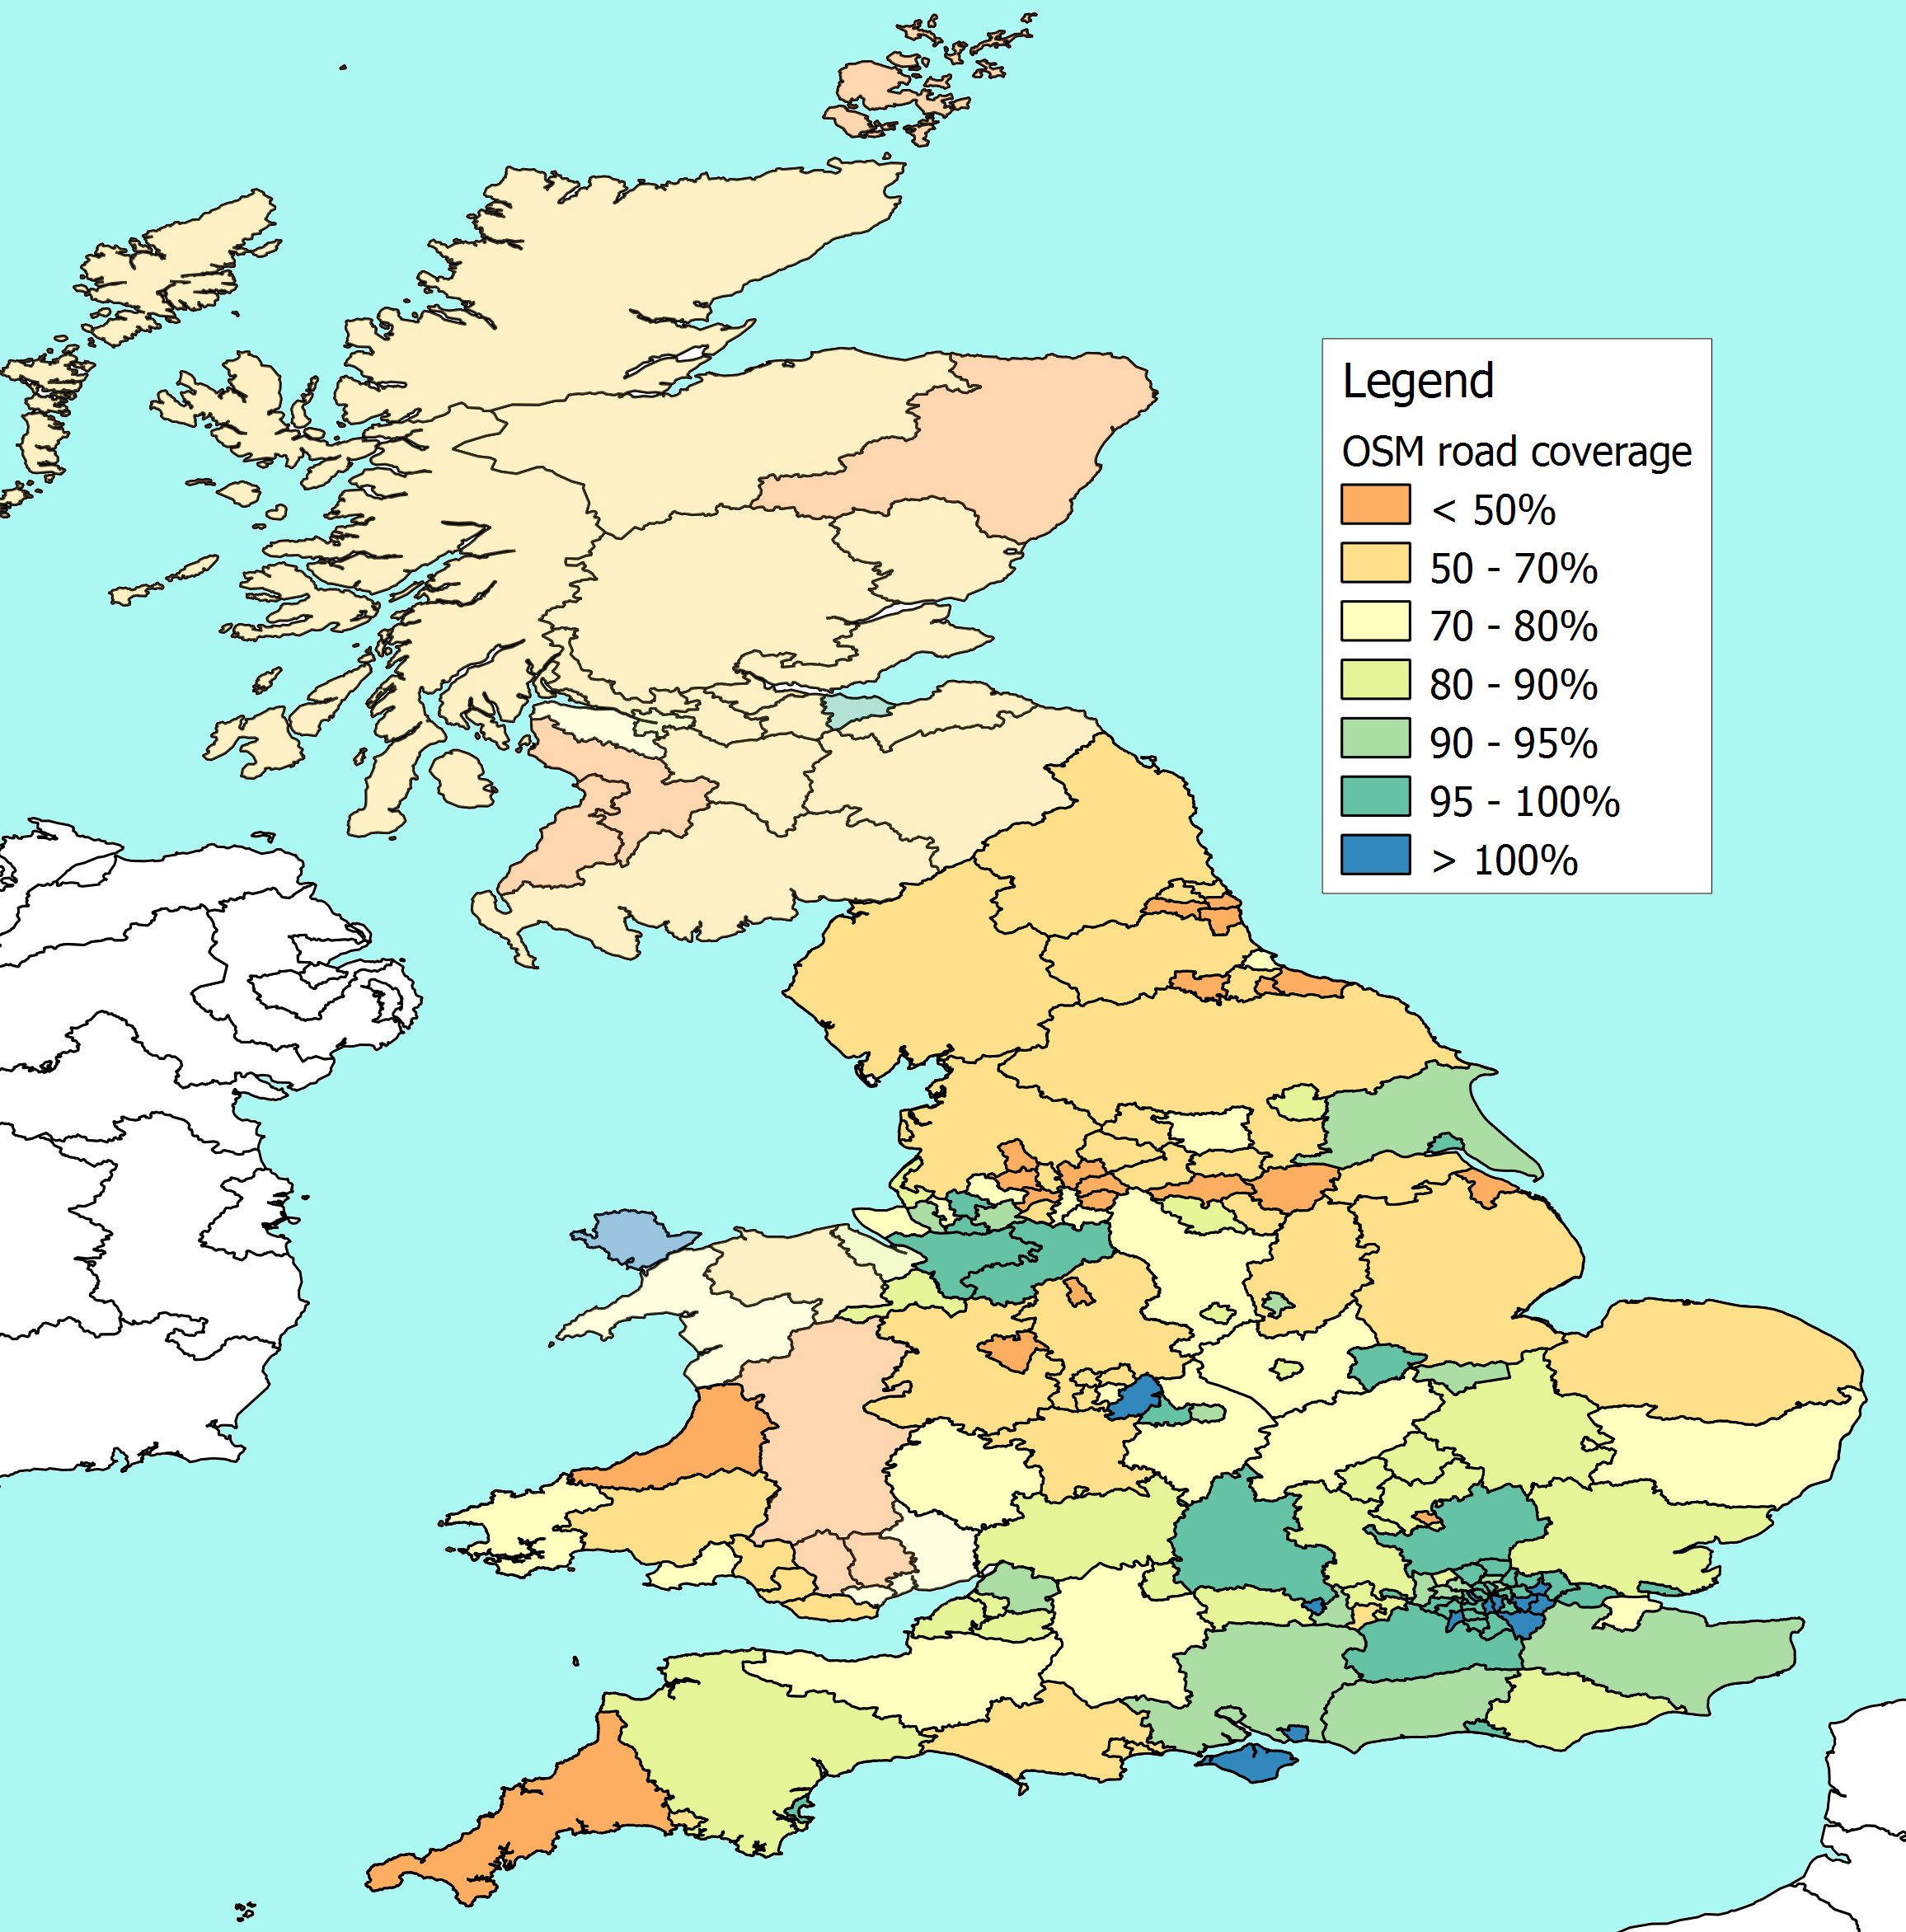
The map shows the data I currently have, and the detailed numbers are here.
The top ranking authorities (and km of roads on OSM as % of DfT road length) are:
- London Borough of Lambeth (106%)
- London Borough of Greenwich (106%)
- London Borough of Barking and Dagenham (106%)
- London Borough of Kingston upon Thames (105%)
- London Borough of Bexley (105%)
- Isle of Wight Council (105%)
- London Borough of Bromley (104%)
- Birmingham City Council (103%)
- Reading Borough Council (102%)
- Portsmouth City Council (101%)
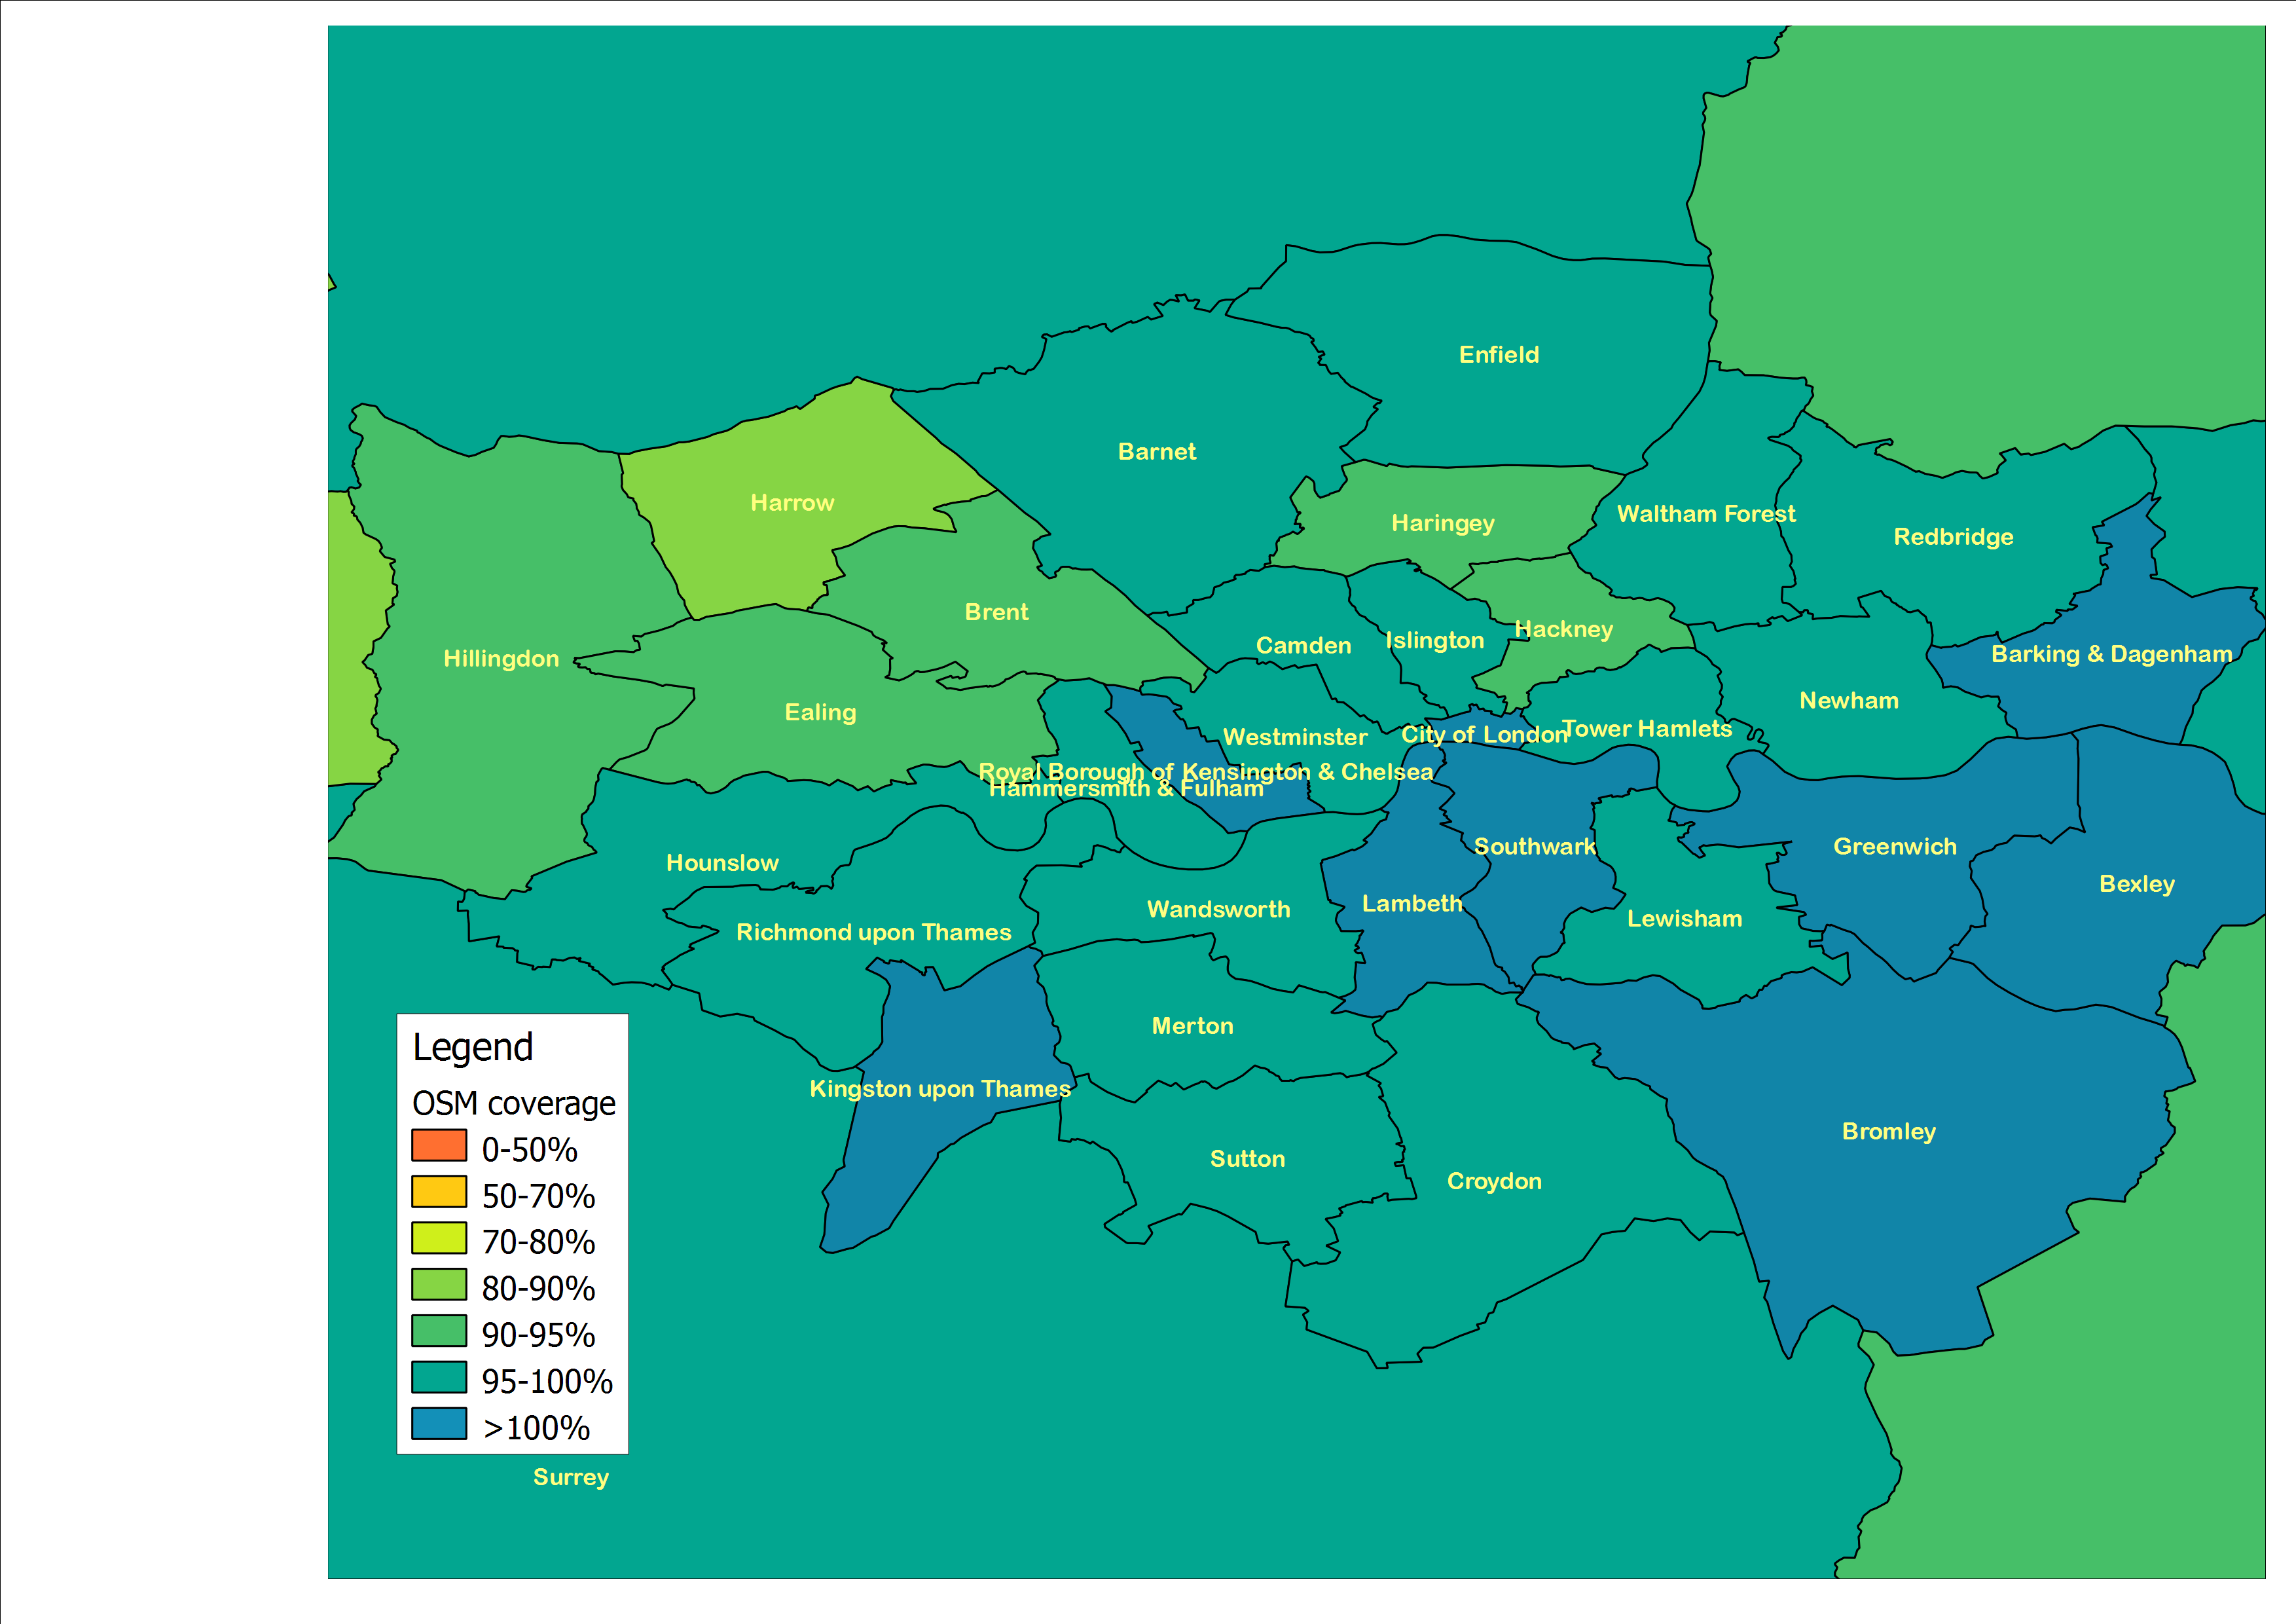
There's a more detailed map of London here.
- Middlesbrough Borough Council (41%)
- Barnsley Metropolitan Borough Council (40%)
- Rochdale Metropolitan Borough Council (40%)
- Bolton Metropolitan Borough Council (39%)
- Sunderland City Council (38%)
- South Tyneside Council (37%)
- Luton Borough Council (35%)
- Tameside Metropolitan Borough Council (32%)
- Oldham Metropolitan Borough Council (28%)
- North East Lincolnshire Council (24%)
Several people have asked about the proportion of named roads, and I have had an attempt at mapping that here. Individual figures are in the data sheet.
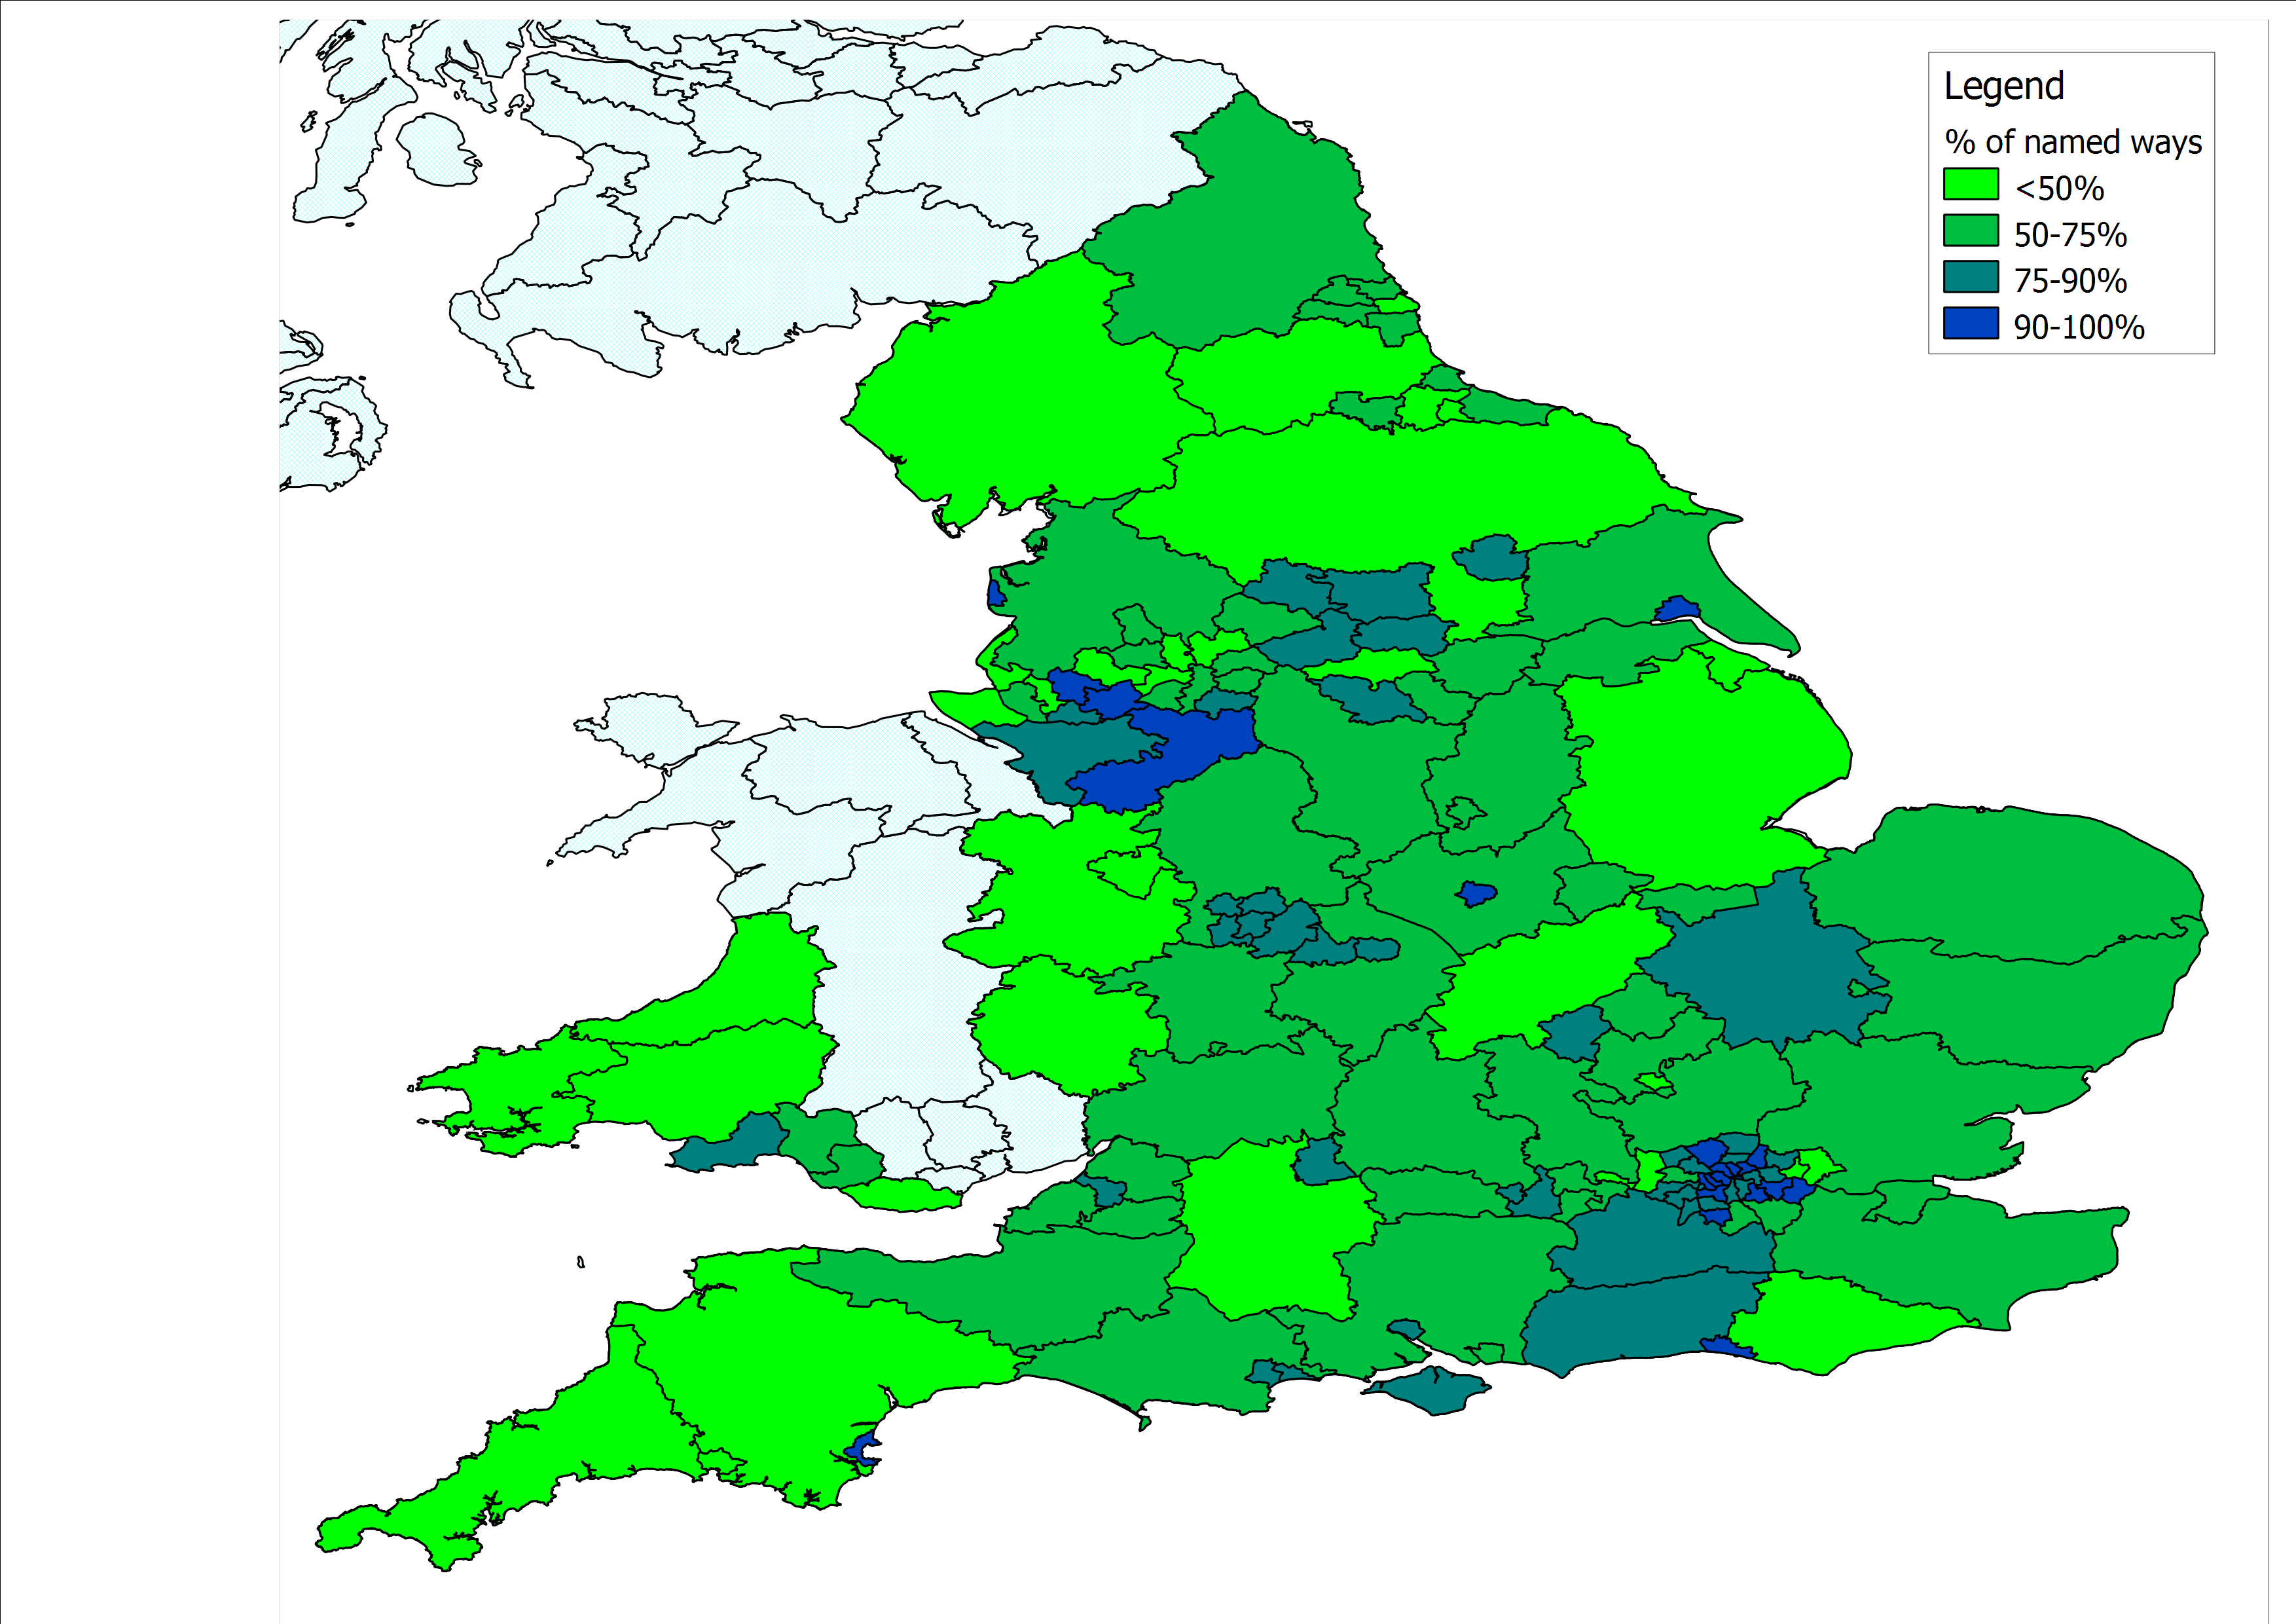
The other figure that may be of interest is the proportion of roads that have been plotted, but not completely tagged. These roads are not included in my totals, because I can't tell what type they are. Broadly speaking they are marked as "highway" but with a type of "road" or "fixme". There are also a few that have been mis-tagged, for example as "highway:some street name" or with a combination of conflicting highway types. But these are a very small proportion of the total. Most are tagged "highway:road" which is normally intended to mean "I know this road is here, but I have not yet decided what type it is". The overall proportion of these is quite low, but it is surprisingly high in some areas - notably Luton, and Northumberland for example, where almost a third of roads in the database are not fully tagged with a recognisable type. Lincolnshire, Suffolk, Somerset, Trafford, Norfolk and Wiltshire also show a high proportion (>10%) of roads that I can't classify. The proportion for each authority is shown in the data as "Percent other".
So my advice is to cancel that holiday in Torquay - it is 98% covered already. Head for Cleethorpes instead, where more than 75% of the roads still have to be added. Other fine places where it should be easy to find unmapped roads are Luton, Middlesbrough, S. Tyneside, Stoke-on-Trent and Sunderland.
No comments:
Post a Comment