Tuesday, 16 October 2012

Local maps

Things have been pretty busy over the last few months. Partly because we are still working through the house decorating, and fixing. Partly because we got a puppy (which provides endless amusement). And partly because we are getting more involved in various local activities. One of those is helping to produce  a newsletter for one of our local societies. I thought some of the items in the newsletter might benefit from a map, so I set off on a journey to work out how best to produce street plans of a small town, with various content overlaid. As I should have known, that's turned out to be something of a diversion.

A few years ago, my first effort at generating maps from OSM data was based on overlaying the standard renders with KML files. That worked fine when I wanted to highlight a route, or a few locations, over a slippy map and place it on a web site.

Later I got it into my head that I would try to replicate the old Bartholomew's half-inch maps using OSM data. I wanted to generate maps that covered quite a large area (roughly the size of a county), and I wanted to do quite a lot of manipulation of the data. I used Mapnik to do the rendering, and a Postgis database to manage the content, with various home-made tools based on SQL and Perl.

Now I only need to cover quite a small area. Most of the time I just want to map the centre of a small town, so the maps are only a mile or so across. Sometimes I will want to cover a bit more of the surrounding area, but still no more than a few miles in each direction. The amount of data that I need to crunch is quite small.

At the moment I'm using Quantum GIS (QGIS), working directly from OSM extracts. There are a few glitches, but for most purposes it works fine. I'm not going to attempt a whole cook-book, but here are some tips, based on my experience so far:

  • I am using the Openlayers plugin in QGIS. Openlayers will add a raster layer to your map pulled from the standard Mapnik render, or from Bing imagery (or various other sources). These help with positioning your overall map, selecting data to download, and editing stuff that you want to add.
  • I use the OSM plugin in QGIS. Among other things, over a small area, that will download data directly from the OSM database, which gets you started quickly. 
  • Change the default OSM styles. I got hold of the "light" styles described here, then edited them to suit my purposes. They look a lot better than the standard styles, particularly when you are overlaying data to highlight features on top of a base map
  • For areas that are too big to work directly from OSM data, I'm downloading the Planet data, and extracting a subset using OSMOSIS. This isn't very sophisticated in the way it trims the bounding box, so you need to add a fairly generous margin to pick up any long ways that run outside the area you are interested in.
  • Where I want to edit data for my own purposes, I'm using Perl to do automated edits on my local data extract, or JOSM on my local extract for manual edits. Every time I do this I'm scared I will accidentally upload my edits back to OSM. If there is a less risky alternative I'd love to hear about it. So far I haven't hit the wrong button. On the sort of data volumes I'm handling this is fast enough, and much easier than Postgis, but I'm beginning to miss some of the more sophisticated Postgis tools.
  • I don't think I've yet worked out the best way to add extra GIS data for my own use. The basics - to add a layer, draw some features, edit them, apply styles and labels - are straightforward enough. However I'm starting to want to go on and edit more attributes, add a mix of lines and points, and the like. But without going into full-blown database management. The tools all seem to be there, but I've not got my head around how to do it easily (yet).
  • I haven't found a decent way of showing the shape of the landscape on my small maps, because the free elevation data is too coarse. Across a slightly wider area covering a few miles, it's not hard to import OS Landform data (ASC format) into QGIS, re-scale it to get smoother shading, then colour according to elevation, add hillshading, contours, or whatever.
  • I've been reprojecting stuff to the National Grid Coordinate system (OSGB 27700, rather than WGS 84). To my eyes, the proportions looks more as they should, and it also allows me to work in map units of a metre, rather than degrees, or pixels.
  • Don't expect everything to work. I'm still having problems with roundabouts, and multipolygons with inners and outers. Most of the time this doesn't matter to me, and where it does I'm kludging the data to work around it. Maybe there's a better solution, but I can live without one for now.
  • In my experience, using data in different ways is one of the best ways of improving quality. So I make a note of anything in the base data that is going to need fixing, so that I can go back and fix it later. But I make sure that I handle the fixes separately from anything in the data that I want to adjust for my own purposes. That way there is no confusion between "I want my map to look like this" and "OSM should hold the data like this". I'm now starting to use separate data and separate layers for the stuff that I pull directly from OSM, and leave unchanged, and the stuff that I am pulling from OSM, and editing before I use it. That's partly just because it makes it easier to manage, but I think it's probably good practice anyway.
The bottom line is, if you want to generate a map of a relatively small area, QGIS may well do the job for you. It isn't a solution straight out of the box, but the learning curve isn't as steep as some of the alternatives. that I've tried.

And if you enjoy doing this stuff, then you might find that the person who edits the newsletter or the web site for one of your local societies might welcome some help.

Tuesday, 14 August 2012

Accidents in 20mph zones

Fullfact has been looking at various media reports on accident statistics in 20mph zones. In essence official statistics show that the number of accidents in 20mph zones has been rising. The conclusion drawn by some media is that this shows that 20mph zones don't work. In reality Fullfact finds that the figures take no account of the expansion in the use of 20mph limits. So an increase in the number of accidents tells us nothing about  the effectiveness of 20 mph zones.

To make any real sense of the raw data we would need to know how many roads have a 20 mph limit, and how much traffic they carry. It seems that the DfT can't help, because they don't know.

I wondered if the OSM data could provide any more information.

OSM contributors have added speed limits to about 9% of the UK road network. As a result, about 3,500km of road currently show a speed limit of 20 mph. That represents just under 1% of the whole road network, and just under 3% of minor urban roads.

We must bear in mind that some 20 mph zones will not yet be added to the database. And OSM data isn't always accurate, so it's also possible that some roads have been marked incorrectly as having a limit of 20mph. We could make some assumptions about roads that don't yet carry speed limit information, but it doesn't help a lot here. It is normally safe to assume that OSM data is incomplete, but less likely that data is inaccurate. So we can make a reasonable assumption that the true extent of 20mph roads is going to be higher than the recorded figure. In other words, we can use the data to estimate that at least 1% of the UK road network now has a 20mph limit, and 20mph limits now represent almost 3% of minor urban roads.

Meanwhile, according to ONS/DfT data, 20mph zones account for just over 1% of all accidents, and 1.6% of accidents in built-up areas. In other words, the proportion of accidents in 20mph zones seems no higher than the proportion of 20mph roads. If we just look at built-up areas then the accident rate in 20mph zones is about half what we might otherwise expect.

Perhaps more importantly, the DfT data on its own shows that the mix of accidents is different under different speed limits. With a 40mph limit, one in 100 accidents involves a death; at 30mph it is one in 200, and at 20mph it better than one in 300. In 20mph zones the number of deaths on the road could be as little as a tenth of the level elsewhere.

All this doesn't get us to complete and reliable figures, it can take no account at all of traffic volumes, and there are surely some more complex causes and effects underlying the data. Nevertheless, if the limited numbers that we have tell us anything, it is that accidents in 20mph zones are in line with the obvious hypothesis that lower speed limits are associated with fewer, less serious, accidents.


More here - http://www.sustrans.org.uk/resources/in-the-news/are-20-streets-really-less-safe


Friday, 24 February 2012

Embarrassed minister apologises for level of infrastructure investment

Norman Baker: "During 2012-13, £11 million pounds will be spent on Bikeability and £8 million will be spent through the growth strategy on off-road infrastructure for cyclists. Funding to local authorities for cycling through successful local sustainable transport fund projects is at least £15 million in the forthcoming year"

Thursday, 26 January 2012

Shops that aren't

Sometimes OSM contributors mark a high street business as an "office" rather than a "shop". There is logic in this. Accountants, employment agencies, travel agents, and solicitors are delivering a service rather than offering goods for sale, and they are normally sat at desks rather than behind a counter or a till. But the boundaries between the two can become blurred.

For a number of professions both keys: "shop" and "office" are fairly widely used in the UK.

The chart shows the mix of "shop" and "office" for some of the more common professions on the high street. Each of the labels shows common variants (after the most widespread term).


There seems to be some consensus among contributors that most accountants, employment agents and travel agents work in offices, while most estate agents work in shops. Opinion is more evenly divided when it comes to solicitors and insurance brokers.

The mix of singular and plural forms (solicitor / solicitors) is a bit of a nuisance, but apart from that I've only got a couple of quibbles. To me, saying that a funeral director operates from a shop feels even more odd than saying that they operate from an office (I seem to be in a minority here). And in my understanding "financial services" covers very broad scope. Describing a financial adviser as offering financial services doesn't convey their role very precisely. Unfortunately that's how many of them characterise themselves. So dissent here is likely to prove fruitless.


Personally, I feel pretty comfortable with the other different combinations. For members of the legal profession who deal directly with the public I like to see the term "solicitor" rather than "lawyer" as it is in line with normal UK terminology. And using a mix of "shop" and "office" keys seems both reasonable and manageable.

Sunday, 22 January 2012

New GPS

I first got a GPS for the bike back in 2008. Astonishingly that was nearly four years ago. It was a Garmin Edge, and I used it to collect traces for Open Street Map, time my rides, and for occasional route finding. A couple of posts here about putting the OSM Cycle Map on a Garmin Edge have generated as much traffic as almost anything else I've written, and I had a bit of an exchange with Wired Magazine when they  illustrated an article on OSM cycle maps with one of my pictures, despite the license conditions.

So we have had some interesting journeys together, but my old Garmin Edge packed up towards the end of last year. I've been using various apps on a Smartphone since, but now I've been treated to a proper replacement - a new Garmin Edge 800.

Things have clearly moved on in the last four years, and this new GPS is lighter, easier to read, with a better mount. The touch screen is a big advantage, and unlike the smartphone, I can use that while wearing gloves.

It didn't come with anything other than a minimal base map, and I obviously wanted to take the OSM cycle map with me. I had generated a copy of this a year ago for the old Garmin. To get started quickly I transferred the memory card across, and found that it still worked up to a point, but minor roads were invisible.

I couldn't find an up-to-date, ready-made version of the OSM cycle map for a Garmin, so again I set out to build my own. The tools in this area have also moved on since I last did this. It has taken quite a bit of fiddling around to make a new version of the cycle map, and so far I have only partly succeeded. I'm still struggling with minor roads, and the sea is missing (which matters more round here than it did in Berkshire).

If I forget about special styling for the the cycle stuff, and just opt for the standard map format, then things are a bit easier. I can generate a nice basic map with a considerable amount of detail, and lots of POIs. As best I can tell, route finding has improved, though it's difficult to know whether to credit the map or the device for that. With the standard format I get to see the sea, as well as minor roads. 


That will do me for the time being, but this is an itch that needs to be scratched. I can see that I'm in for a bit of fiddling with mkgmap styles over the next few days (unless anyone has a better suggestion).

Friday, 20 January 2012

Impersonating a police officer


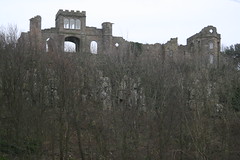
Today's destination on the bike was this odd structure, which is called Ratcheugh Observatory. It isn't an observatory in the same sense as the Royal Observatory at Greenwich, or Jodrell Bank.

It was commissioned by the 1st Duke of Northumberland, and designed by Robert Adam towards the end of the 18th century. The room on pillars allowed the Duke to observe his lands (or at least part of them). It was one of a number of monuments that he built in memory of his wife (who died in 1776) at their favourite picnic spots. That seems rather sweet, but their favourite picnic spots mostly seem to have been in places where they could admire the extent of the properties they owned.

This was also my first chance to try out my new GPS, but more of this later.

It was a nice ride, and good to get out, but it was a bit of a grey day. So I was wearing a bright yellow, high visibility jacket. On my way home, I passed a police station, and a toddler in a buggy yelled out "look mummy, there's my daddy". It was all a bit like Jenny Agutter in the Railway Children. I don't think I've ever been mistaken for a policeman before. Thankfully, the mother had better eyesight.

Tagging of shops

One of the challenges in adding various different types of retail outlet to the map is that retailers have always had a habit of finding gaps in the market where they can expand their range, in order to reach more customers. So whatever boxes we try to put shops into, somebody is trying to break out of them. We happily buy sweets from a newsagent, and kitchenware from a hardware shop.

It is difficult to measure how contributors tag individual shops, because variations in the data reflect variations in the real world. But because big chains tend to operate a lot of similar shops, we can look at the different ways these are tagged to get some idea of how contributors handle difficult categories.

To keep this in proportion, there are several large chains where there isn't much of an issue. In these cases there is a high level of consensus, and almost all branches in a chain carry similar tags. This suggests that most contributors see the same type of shop. Examples where more than 80% of branches carry the same value for the "shop" tag include Tesco, Sainsbury, Lidl, Morrisons, Asda, Aldi, Waitrose, Iceland, Somerfield and Tesco Metro = supermarkets; Londis, Premier, and One Stop = convenience stores; B and Q and Homebase = doityourself; Greggs = bakery; and Next = clothes.

Other chains seem to be operating across a genuine boundary between two similar categories. As a result a limited number of different tags have been used across the whole of the chain. Among the big chains this mainly applies to certain brands of supermarkets / convenience stores, typically with 50-75% of branches in one category, and the rest in another: examples include Co-op, Spar, Tesco Express, Costcutter, Cooperative Food, Sainsburys Local and Budgens.

Other chains have business models that are proving more difficult for contributors to categorise. This often seems to depend on how much emphasis the retailer places on offering a wide range of goods, or specialising in one type (or at least on how different contributors perceive this balance). In these cases different contributors normally choose between just a couple of options. For example, both shop=department_store and shop=clothes are commonly applied across chains such as Matalan, Debenhams, TK Maxx.

There are a few cases were there is a wide variety of different categories within the same chain, and little consensus between contributors. These seem to be chains that do not just offer a wide range of goods, but also compete with others that are much more specialised. There are a few where there is a huge mixture of tags. Contributors have used ten or more different values for "shop" to describe each of the following examples: Halfords (with 34 different values for "shop"; "bicycle" as the most common); Argos (25 different values for shop); Marks and Spencer; W H Smith; and Wilkinson.

So the challenge facing contributors is often that a shop offers a range of goods (or a shop format) that cannot easily be pinned down. But there are also some areas where there seems to be consensus among contributors on the type of shop they are dealing with, but not necessarily on  the best tag to use. The most common examples use different terminology which means much the same thing - such as shop=betting or shop=bookmaker (for William Hill, Ladbrokes, etc). Either "shop=alcohol" or "shop=beverage" is common used for chains such as Bargain Booze, Oddbins, and Thresher.

Supermarkets and convenience stores are an example where one term is better recognised for smaller shops, and a different term among larger chains, with both covering similar scope. There are similar examples, including hardware shops and do-it-yourself stores, with a certain amount of overlap between the two.

Finally, there is the issue of spelling mistakes: abbreviations, plural / possessive forms, and alternative approaches to capitalisation and spacing ("newsagent", "news agent", "News Agent", "news_agent", or even "newspaper", or just "news"). It is not difficult to find examples like this, but in practice they don't seem to account for a significant proportion of the total. It is mainly a problem where the normal term for the shop is long, or uses more than a single word, but even there it's not a particularly serious problem. Out of the list of different terms for shops selling newspapers, "newsagent" accounts for 98% of occurrences in the database. In general, around 99% of shops with spelling variations are tagged with the most common value, while the rarer variants account for only 1%. As far as I can see the widest variations in the UK are among DIY shops (variously tagged : doityourself, diy, DIY, etc.) and estate agents (tagged "estate agency", "Estate Agent", "estate agents", "estate_agency", etc.). Even in these, the most common option has been applied across more than 90% of the sample.

The bottom line is that while it is easy to envisage a tool to fix spelling variants, this isn't the real challenge. There are a few cases where more consensus on terminology would make things a bit tidier. But the real challenge is to find better ways of handling nuances between the different business formats that we find in the real world - such as where we use different terminology for different sizes of shop, or for different levels of specialisation. It's hard to imagine a tagging scheme that is going to directly solve the problem of where to buy a spanner, a cycling magazine, or a bottle of balsamic vinegar. Some problems are probably best left to a fuzzy search process. In the meantime the best approach for contributors seems to be to stick to the common values when adding a shop; and pick the value that best describes what we see on the ground.

Nothing new there.

Thursday, 19 January 2012

Spring cleaning

I've just been weeding out dead links in the blog roll. I should have done it a couple of months ago. Because then I would have discovered earlier that Rob Ainsley's excellent Real Cycling burst back into life last November.

Wednesday, 18 January 2012

Schools

In the same spirit as my earlier posts on OSM coverage of shops and healthcare facilities, I've now had a crack at estimating the number of schools that can be found on the map. I've used Department for Education figures to get an estimate of the number of schools we should find in each local authority area in England. These are pretty comprehensive. They include  independent schools as well as state funded primary and secondary schools. They also include some nursery schools (basically those receiving state funding), special schools (for children with specific educational needs) and pupil referral units (for children excluded from other schools).

By comparing these figures with the number of features in OSM that are tagged as a school I get an overall figure for coverage of schools in England around 75% - which looks pretty good. Local authorities that have particularly thorough coverage include Cambridgeshire, York, Sheffield, Hartlepool, and Bath. There's a patch around Barnsley, Doncaster, and Rotherham where coverage is low.

Some of these figures look too good to be true. I suspect that my collection of OSM features is too crude, and that this results in some double counting - perhaps as a result of the way campuses have been tagged. That's going to take a while for me to investigate, but meanwhile, this is what the first iteration looks like.


Tuesday, 17 January 2012

Primary healthcare

Our ability to access public services has been used as one indicator of social inclusion and quality of life.

To help with transport planning and other aspects of policy, governments have measured the ease with which we can access education, and healthcare, using public transport, walking or cycling. They also measure our ability to reach food shops, and employment. It occurred to me that it would be interesting to know how well OSM content covers similar ground.

Since policy makers see access to such facilities as being important, perhaps there are creative ways in which OSM data could be used to make it easier for people to reach key public services?

At the moment I can’t see how to replicate the official measures exactly. I can't see an easy way of measuring completeness of food shops, but I can get somewhere near by trying to measure how well all shops are covered. In healthcare I can compare lists of NHS GPs, Pharmacies, Opticians and Dentists in England with those I can find in the OSM database. I'm not sure where to find similar data for Scotland and Wales. At some point it should be possible to produce a similar measure for schools, but I haven't got round to it yet.


Breaking the lists down by local authority, I reckon that Halton, Wokingham, Cambridgeshire, Islington, and Derby score particularly well mapping local healthcare, with around half of their facilities mapped. Luton, Blackburn, and Doncaster have the most healthcare facilities to add. In those authorities I can find less than 2% of the number of facilities I expected to see in the database.

Looking at both healthcare and retail together, most places show similar levels of coverage for both. Derby and Islington seem to have particularly good coverage of retail, alongside some of the highest coverage of healthcare facilities. Other areas that rank highly on both counts include Bedford, Birmingham, Cambridgeshire, Camden, Halton, Southwark, and Wokingham.

It's worth noting that I'm using government data as a way of measuring OSM data, not the other way round, and this is not to suggest that OSM should be deliberately working towards a comprehensive directory of this stuff. It is interesting, though, to speculate what kind of new applications might start to be viable as coverage develops.

Friday, 13 January 2012

Convenience stores and supermarkets

The standard classification system for different types of business uses the concept of "Retail sale in non‑specialised stores with food, beverages or tobacco predominating". This makes two important distinctions: between non-specialised, and specialised shops (Sainsbury's vs the local butchers); and between shops that are mainly concerned with food (Waitrose) and shops concerned with other stuff (John Lewis). It still covers a wide range of different types of business - from a hypermarket to a cinema kiosk (including village stores, NAAFI shops, confectioner / tobacconists, and old-fashioned grocers).

In this context, OSM contributors make widespread use of "supermarket" and "convenience store" to describe non-specialised food shops. There are a few tagged "kiosk", "general store" (in various spellings), or "grocer" (in various spellings) but these only amount to about 2% of the total in this area. There is only a smattering where different shop types are combined in forms such as "convenience;alcohol".

The retail experts, IGD, reckon that there are 91,500 stores selling groceries in the UK, of which almost 8,000 are supermarkets (or variants), and more than 48,000 are convenience stores. About 6,500 of the convenience stores are on forecourts. Most of these will probably be marked in OSM as a petrol station, rather than a shop. That leaves nearly 42,000 convenience stores that we should be able to find. However, this might still be over-stating things a bit. The Association of Convenience Stores reckons that there are 33,500 convenience shops in the UK.

Across Great Britain I can find 5,849 supermarkets in the OSM database, and 6,928 convenience stores. So on face value, current coverage of supermarkets is about 73% and coverage of convenience stores is about 16-20% (depending on what baseline we use).

Normally a convenience store is quite a small store, with extended opening hours, while a supermarket is larger, and opening hours are more tightly controlled. In the UK, shops smaller than 280 square metres (about 3,000 sq. ft.) have greater flexibility on Sunday trading hours.

Where a shop is added to OSM with a building outline we can get a rough idea of the floor space, and we can use 3,000 square feet as as way of distinguishing convenience stores and supermarkets. There's no point in being rigid about this, but in general a "supermarket" with a floor space of less than 3,000 square feet is probably a convenience store, and a "convenience store" with floor space of much more than 3,000 square feet is probably a supermarket.


Where I can measure them, the average floor space (actually building footprint) of a convenience store in the OSM database is 2,000 square feet, and the average floor space of a supermarket is 43,000 sq feet. Both are well inside the right range. However, about 4% of features tagged "supermarket" could be in the wrong category, and about 20% of features tagged "convenience store" could be in the wrong category (though most of these are still quite small). Re-allocating these according to size rather than tagging would take supermarket coverage up to almost 90%, and convenience store coverage down to around 14-17%.

The bottom line is that coverage of supermarkets looks pretty thorough - the majority are in the database, they can easily be identified, and tagging is pretty consistent. Coverage of convenience stores is better than for most types of shop, but could be more thorough. Many can easily be identified in the database, but some of those might better be tagged as "supermarket".

According to the Department for Transport, most of us are within 10 minutes of our nearest food store, and within reasonable travelling distance of 3 or 4. The chances are that at least one of these is in the OSM database, and at least one is still waiting to be added. The missing ones are likely to be some friendly local convenience store - not some massive supermarket chain. Which hardly seems fair.

Thursday, 12 January 2012

The lost shoppers

Today's retail trading statements make gloomy reading. Shops had a slow autumn, followed by heavy discounting over Christmas, and face various other pressures. I thought it might be timely to look further at OSM coverage of the retail sector to see how things were going from a different perspective.

So far, I reckon that about 10% of shops in the UK have been added to OSM, but it's a bit of a mixed picture.

The coverage varies by type of shop. Post Offices and Cycle shops seem to be well covered (I reckon that about half of each are in the database). Garden Centres, Clothes shops and Computer shops are covered better than most types of shop (around 20% of each have been included). Butchers and Off-licences are close to the average (at around 10%). However I can only find a small proportion of the expected number of Flower shops, Furniture shops, Fishmongers, Greengrocers and Hardware shops. On face value the coverage of supermarkets is particularly good, but these are difficult to classify accurately so these figures are a bit iffy. Given the public spirit that drives a lot of OSM activity I was slightly surprised to see that coverage of charity shops is quite low (6% or so).

There are regional variations. I reckon the most densely mapped areas have recorded around half of the shops on the high street, while the less well covered have recorded only one shop in a hundred. These rankings for shops follow a different pattern to the rankings of road coverage. For example, Derby and Islington are doing particularly well recording shops. Although Islington also comes fairly close to 100% in the ITO comparison with Ordnance Survey road data, Derby comes further down the same rankings.  Wolverhampton does pretty well on both rankings, while Wigan scores well on streets, but near the middle on shops.

(with apologies to various rural counties, there was an error in the previous version of this map, which this one seems to fix)


To produce the map I extracted OSM data related to shops, and allocated each within the relevant local authority boundary. For comparison I use National Statistics on the distribution of retail units by local authority. This only covers VAT and PAYE registered businesses, so it will understate the actual numbers of shop units in each authority. Hence the raw percentages will be over-stated. However, it should be a good enough proxy to compare geographic distributions. To measure the proportion of each different type of shop recorded in OSM I used estimates of the actual number based on a mix of public domain data from National Statistics, Valuation Office data drawn from business rates, and figures from various trade bodies, and industry analysts.

Wednesday, 11 January 2012

Embedding a map

Dara Ó Briain, no less, asked this on Twitter today "Does anyone know how to grab a portion of a map from google map, say, to include in a document?".

That was 11 hours ago, so he has probably had loads of answers by now. If not, here is how I would do it...


  • Go to Open Street Map
  • Zoom and slide the slippy map to the area you need. 
  • Hit the "Export" tab.
  • Choose the format you want (it's probably going to be Mapnik for a document, or embeddable HTML for a web page).
  • Choose the option you want (its probably going to be PNG or JPEG to embed in a a document. If you don't know which of these you want then it probably doesn't matter, so use the default. Use PDF if you want to email something that people can easily print).
  • Hit the Export button.
I claim my free puppy.

Friday, 6 January 2012

First ride of the year


On the way I passed this milepost, which tells travellers how far they have to go to get from A to B. It's a kind of 19th century GPS I suppose - but I wouldn't want to carry one of these around with me.

I didn't do anything as exciting as travelling all the way from A to B today though. I just did a short, fairly hilly loop of a few miles.

In 1901 Charles Harper described this section of road as "a weariness and an infliction to the cyclist, for it goes on in a heavy three miles' continuous rise". I cunningly rode it in the opposite direction, so at this stage I was on a steady descent. I'd done the climbing earlier though, so I feel that I had paid my dues.

Monday, 2 January 2012

Ten bike rides that I won't be doing in 2012

What with one thing and another I didn't get out on the bike as much as I would have liked in 2011. I've resolved that this year will be different, but one has to draw the line somewhere.
  1. I believe the views at Alpe d'Huez are impressive, but it does look a bit crinkly. 
  2. I haven't got the right bike to participate in the Brompton World Championships
  3. It's one thing not to wear special clothes for cycling, but another to wear none at all. For the sake of spectators I've decided that I should give the London Naked Bike Ride a miss again this year.
  4. There are still a few days left to apply for the Fred Whitton Challenge, but I understand they are normally over-subscribed, so I ought to give somebody more deserving the chance to pick up the gauntlet. 
  5. Six months to cycle round the world? That's far more time than I can spare.
  6. The Tweed Run promises a metropolitan bicycle ride with a bit of style. I don't qualify. Not even a bit.
  7. There are good reasons why they invented the safety bicycle, and I wouldn't be joining the Knutsford Great Race, even if it was on this year.
  8. I'll pass on this one as well. I don't know where it is, but it lies well outside my comfort zone.
  9. I don't own any lycra. Just one reason for ruling out the Giro D'Italia 
  10. We now have enough space (and enough weather) for a virtual reality trainer, but I reckon that I've already spent far too much of my life sitting inside staring at a computer screen
And that's about it. There are a few rides left to chose from. Some of them might be a bit of a challenge, but mostly I suspect that I'm just going to be pootling around slowly, exploring the local area and enjoying myself for another year. And there's nothing wrong with that.